How to Design a Good Survey and Avoid Respondent Fatigue
Discover what makes a good survey – and how the results of our recent “looping” test can help you create one.

What Makes a “Good” Survey?
Data-driven surveys play an essential role in generating insights and informing decision-making across various industries. They provide a systematic method for gathering information from a sample population, allowing organizations to make choices based on accurate and representative data. The quality of these decisions is profoundly impacted by how a survey is designed; with poor design leading to inaccurate data, low response rates, and biased results.
Ask any good researcher what makes a “good” survey, and they’ll tell you it’s all about keeping the respondent front and center. Ultimately, that remains the crux of it – but here, we delve a bit deeper into exactly what makes a good survey and crucially, how the results of our recent “looping” test can help you create one.
The Five Pillars of Good Survey Design
Let’s start by taking a look at the Five Pillars of a “good” survey, and why they need to be non-negotiable on your survey design checklist:
- Accuracy and Reliability – Well-designed surveys are critical for collecting accurate and reliable data. By crafting clear and concise questions, you can minimize misunderstandings and ensure respondents interpret questions correctly. This reduces errors and variability in responses, leading to more dependable data.
- Respondent Engagement – Engaging surveys with a logical flow and a user-friendly interface encourage respondents to stick around. Features such as progress indicators, personalized language, and appealing visuals can keep participants interested and reduce dropout rates.
- Data Validity – Designing surveys with well-defined questions, appropriate response options, and an avoidance of leading or loaded questions, helps capture genuine responses. This enhances the validity of the data collected.
- Bias Reduction – Minimizing bias in survey responses contributes to obtaining credible data. Effective methods include randomizing question order, using neutral language, and providing balanced response options. This helps to prevent systematic errors and ensures the survey results are representative of the broader population.
- Cost and Time Efficiency – Efficient survey design saves time and resources. Streamlining the survey process by eliminating redundant questions and optimizing the survey length can reduce administration time and costs. Additionally, using digital tools and mobile-friendly designs can reach a wider audience quickly and cost-effectively.
Respondent Engagement Test: Tackling Fatigue and Mitigating the Dreaded “Don’t Knows”
While the Five Pillars form the basis of any good survey, there is another critical area to consider. When it comes to survey design, repetition is a challenge across the board. It’s a necessary measure for lots of brands seeking to benchmark their awareness and reputation against competitors, for example, but repetition or “looping” (repetition of a question, including wording and visuals), can really sabotage respondent engagement.
So, whilst the Five Pillars are tried and tested components of any good survey – we wanted to find out more about the impact of looping, and how it can be effectively mitigated. Cue our “looping” deep dive – a study to understand how repetition influences data quality and respondent engagement – proving our hypothesis that data quality declines after a third loop, as participants become fatigued or disinterested.
So How Did our Looping Test Work, and What Did it Reveal?
Our test was structured to create varying survey experiences. Some respondents encountered more repetitive loops (more than three), while others experienced a less repetitive version. The setup aimed to compare how data quality varied as the repetition increased.
The methodology included a nationally representative sample of 1,000 participants, evenly split between five survey versions. All respondents answered the same questions, designed to test the effects of looping. After completing questions for one brand, respondents would immediately move on to answer the same questions for another brand. Each group experienced a different level of looping, ranging from two to six. The goal was to observe if respondents’ answers changed as the section was repeated more and more.
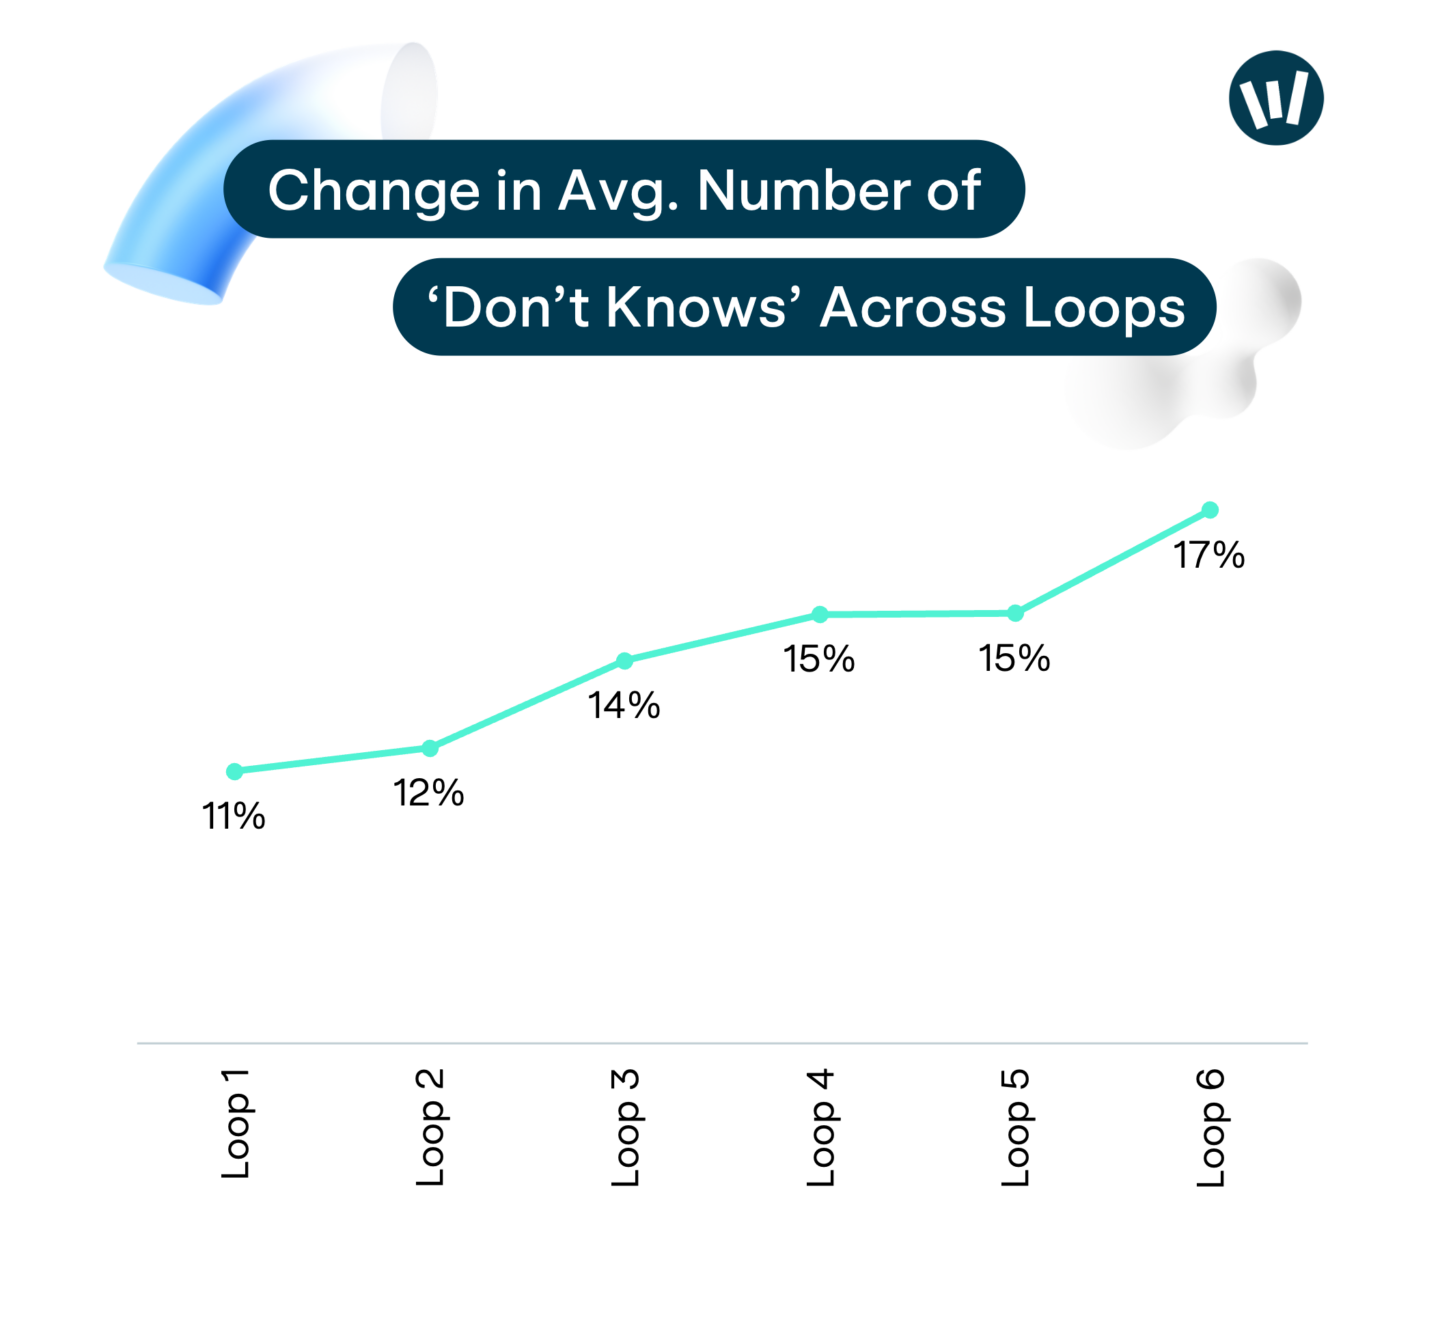
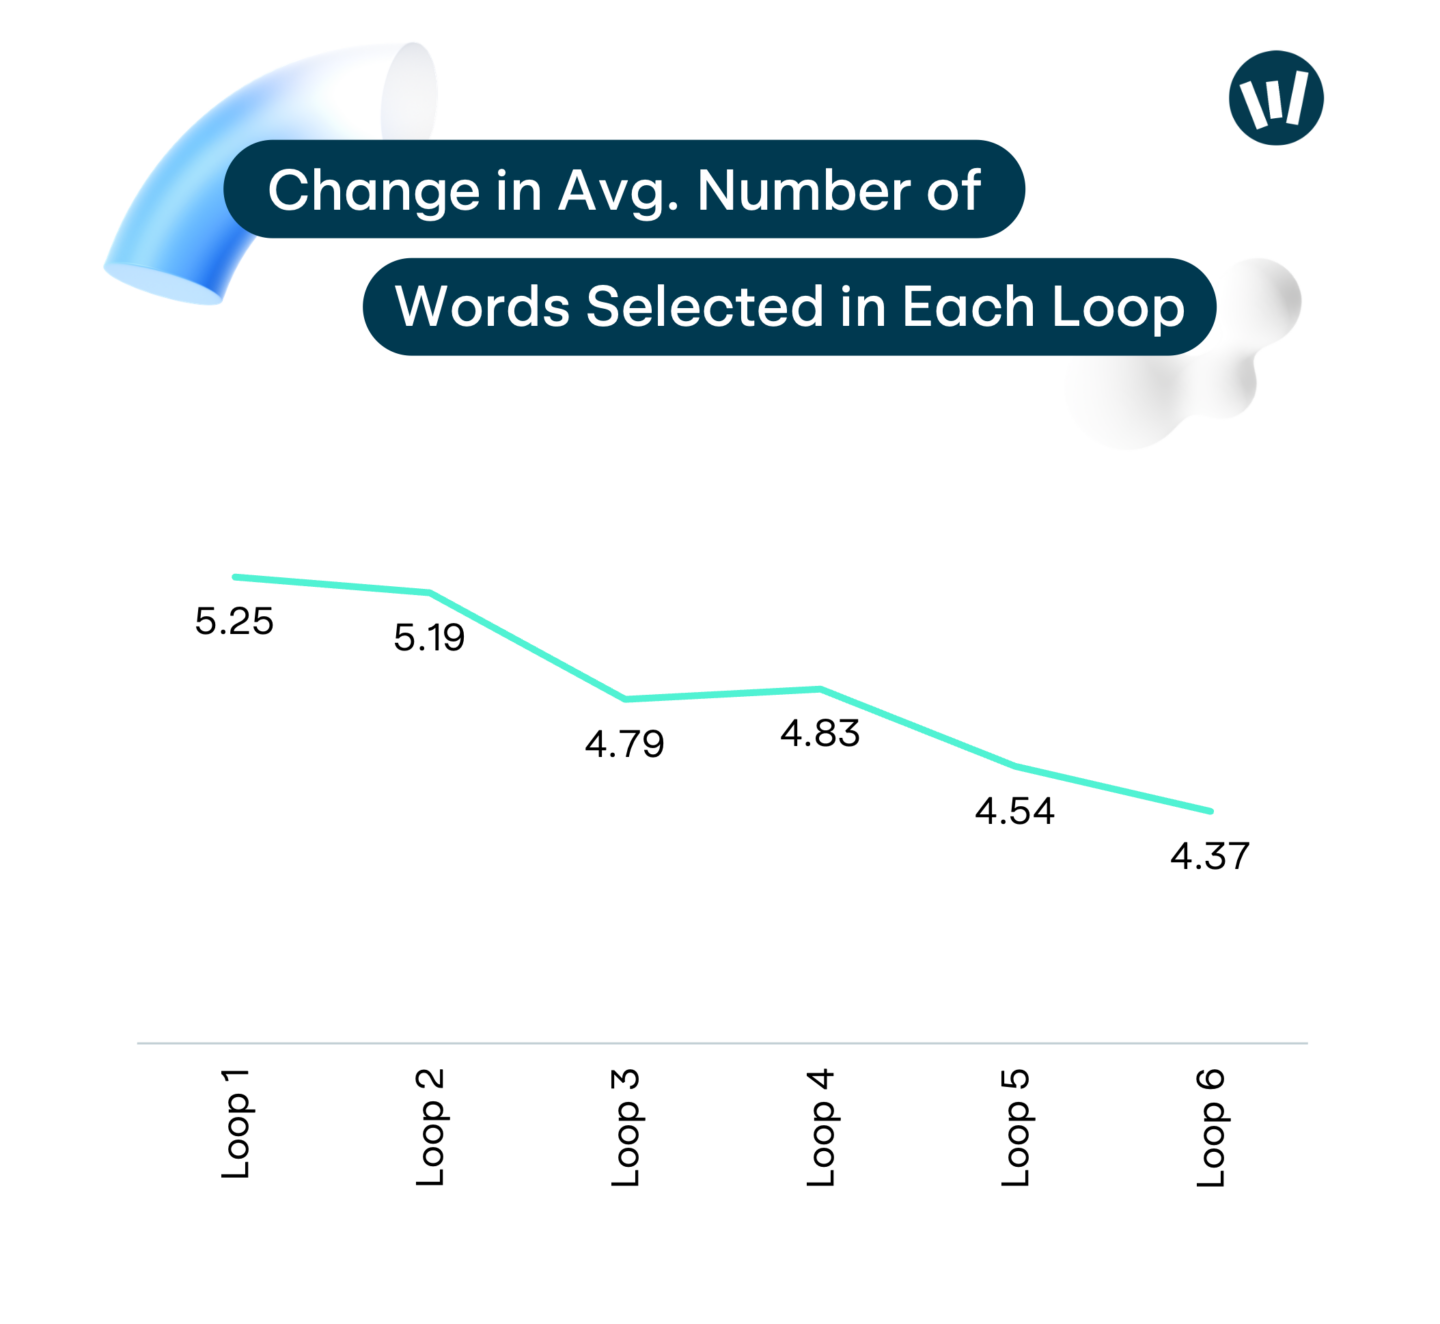
The results were telling. As the survey experience became more repetitive, data quality significantly deteriorated. The number of “Don’t know” responses in the later loops increased by 50% compared to the first loop, indicating that respondents were less thoughtful about their answers as the survey progressed. Additionally, the number of word associations for each brand dropped by about 20% in the later loops, further demonstrating reduced engagement and consideration.

Both these findings were statistically significant at the 95% confidence level, reinforcing the hypothesis that from the third loop onwards, respondents began to experience monotony, leading to a decline in data quality. This suggests that excessive repetition in survey design can lead to fatigue, disengagement, and less reliable data.

Mitigating Repetition Issues in Survey Loops
Loops are an essential component of many surveys, particularly those focused on brand tracking, consumer perception, and customer insights. However, the inherent repetition can lead to disengagement, which in turn impacts data quality. Fortunately, there are ways mitigate these issues and ensure the collection of high-quality data.
One effective way to counteract the impact of respondent drop-offs and increased “Don’t know” answers is to increase the sample size. A larger sample size helps ensure the data remains robust, as the additional responses can offset the degradation in quality that occurs as participants move through repeated survey loops.
Another thing worth considering is the inclusion of matched cells in your survey design. This involves creating groups of respondents that are matched on specific characteristics to ensure comparisons between groups are fair and balanced. This method can help reduce biases that may arise from demographic or psychographic differences among respondents. For example, if you are testing different survey designs, ensuring that each group is similar in terms of age, gender, or other relevant factors can help isolate the effects of the survey design from other variables – even in the face of potential challenges posed by survey loops and repetition.
You’ve Got the Tools to Build a Great Survey – What Next?
We’re in a world that’s saturated with data. This makes it hard to both cut through the noise and make informed decisions based on robust and accurate results. But that doesn’t have to be the case. Keeping the Five Pillars front of mind and making small, thoughtful adjustments centered around your respondents’ experience, can make all the difference.
If you’d like to speak to our experts to understand how you can optimize data collection, contact our team today.
Book a demotoday.
Do you want to see our solutions in action? Book a demo with our team today.
Insights from walr.

Customizable Services: The Human Touch in an Age of Automation

The Power of Professional Relationships: Insights from Matt Jorgenson


