

What is Data Creation?
We create data to help businesses accelerate, optimize, and simplify their online research process. We define data creation as the section of the primary research process that encompasses survey programming, fieldwork, and data analysis, delivered by experts, and supported by brilliant technology.
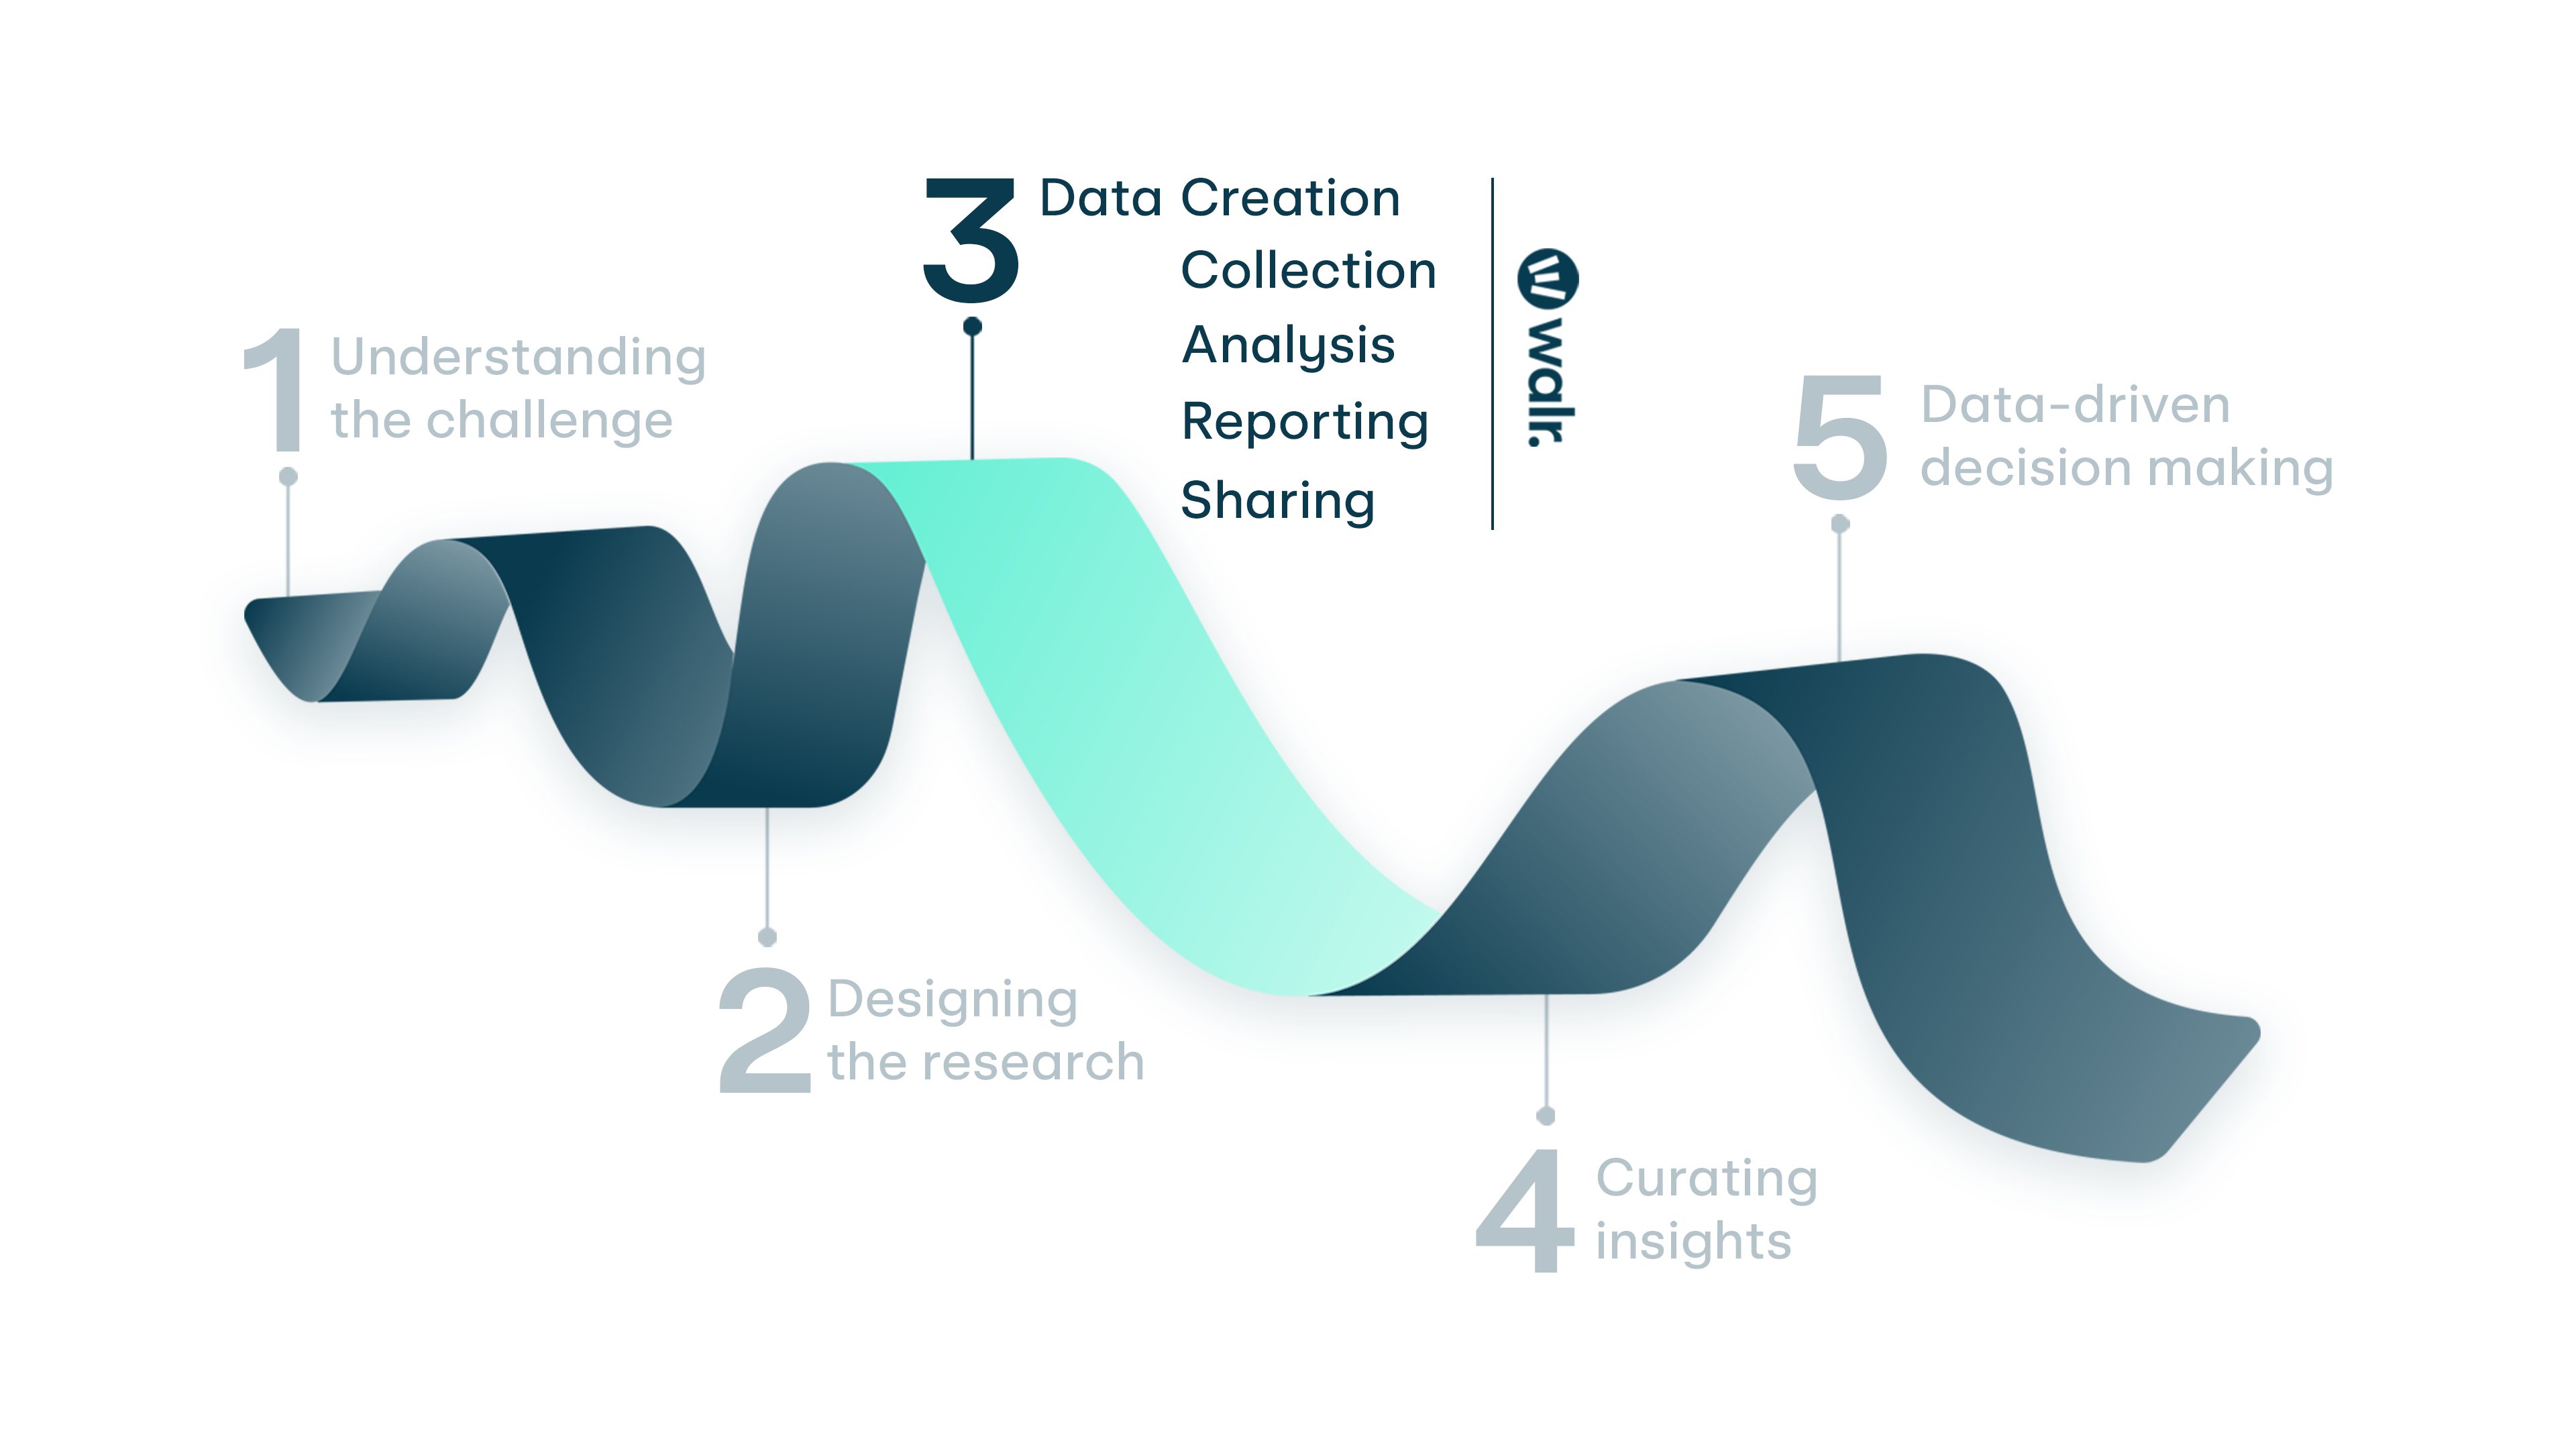
For us it includes:
- Collection – identifying audiences and appropriate sources.
- Storage & management – providing a secure environment for data retention.
- Analysis – checking, validating, and processing data.
- Visualization – creating outputs, which are easily accessible and deliver impact.
- Distribution – facilitating data collaboration.
Why Do We Use the Term ‘Data Creation’?
The online research sphere can be broadly broken down into three stages:
- Programming questionnaires
- Targeting audiences
- Analyzing the data
At Walr, we don’t see ourselves confined to one stage; we support customers wherever they need us along this journey. That is why we choose to use the term ‘data creation’.
How Do We Support Clients At Each Stage of the Research Process?
Programming the Questionnaire
The data creation process begins when we receive the questionnaire from the client. As a first step, we review the format so the design is appropriate for the specified research objective; this includes ensuring all logic and routing within the questionnaire makes sense. We also offer suggestions for improvements, including the use of our own proprietary questions, where we think they will enhance the respondent’s experience.
Our team of survey programmers then create the online script in our Survey Builder application. Once complete, it will go through an internal round of quality checks before being shared with the client for feedback. When signed-off, it is ready to be deployed to respondents.
Targeting the Audience
As part of the bidding process, we will have agreed with the client the audience they wish to target and will have provided a guaranteed feasibility, cost per interview (CPI) and time in field, based on the estimated incidence rate of the audience, and the length of the interview.
Our team of sampling experts then decide which channels of supply to use to target the specific audience. They increase the chances of the right respondent being invited to the questionnaire through pre-targeting, based on profiling information already held. This is then confirmed through the screener questions, which will have been programmed in the questionnaire.
The next step is where we implement our first quality control measure, though our proprietary Gatekeeper tool within the Walr Platform. This includes digital fingerprint checks to ensure the respondent is indeed a real person, and the inclusion of trap questions, to make sure they are the right type of respondent and are paying proper attention to the survey instrument.
When a survey is set live into field, we soft launch with an agreed % of the overall sample target to make sure all is going to plan, in terms of both survey performance and data quality. Once we and the client are happy, we then proceed to full launch to hit the target feasibility in the agreed timings – if not before.
Throughout the fieldwork period we constantly monitor progress to ensure any pre-agreed quotas are being filled in a balanced and timely manner. We also keep the client updated on an agreed cadence using our online reporting link.
Analyzing the Results
The analysis of the results actually begins from the moment we launch the survey, ensuring the audience is delivered as per specification and the data is of the appropriate quality.
For in-field quality checks we look for the time it takes a respondent to complete a survey, patterned responses and the quality of any open-end questions included. If we are not happy with any survey complete, we remove it and replace the respondent – free of charge.
At the end of the fieldwork period, when the target quota has been achieved, we prepare the deliverables as per the client’s specification. This can be as simple as providing an SPSS file or the raw data in Excel. We can also produce full data tabulations with stats testing and charting in PowerPoint.
More and more of our clients now to choose to receive their deliverables via the Walr Platform in our Analysis & Reporting application. Cross tabulations, tables and/or charts can either be created from scratch or uploaded by our data processing team. This gives clients full flexibility over how the deliverables are created and edited. If any alterations are made, they can be re-exported to numerous file formats.
There is also our new dashboarding tool, Pinboard, which allows for any deliverables to be curated into a fully customizable, web-based story, complete with charts, tables and text commentary.
When clients are happy with their outputs, they can digitally share their findings not only within their organization, but with their clients too.
Delivering a More Scalable Research Model
By combining expert support and proprietary technology, our clients benefit from a more efficient, cost-effective, and scalable research model. They can ask the right questions to the right respondents, analyze the data efficiently and at speed, and share the results via the Walr Platform, in any format they desire.
Our core aim is to take away the operational burden of research, to give our clients back precious time to focus on adding value and creating impact.